Energy Shock, Core Problem. The April CPI Just Made the Fed's Job Harder.
The April CPI Report Just Landed — and It Came in Hotter Than Expected. The Fed's Job Just Got Harder. The April Consumer Price Index is out. Headline inflation came in at 3.8% year over year — above the 3.7% consensus forecast and the highest annual inflation rate since May…
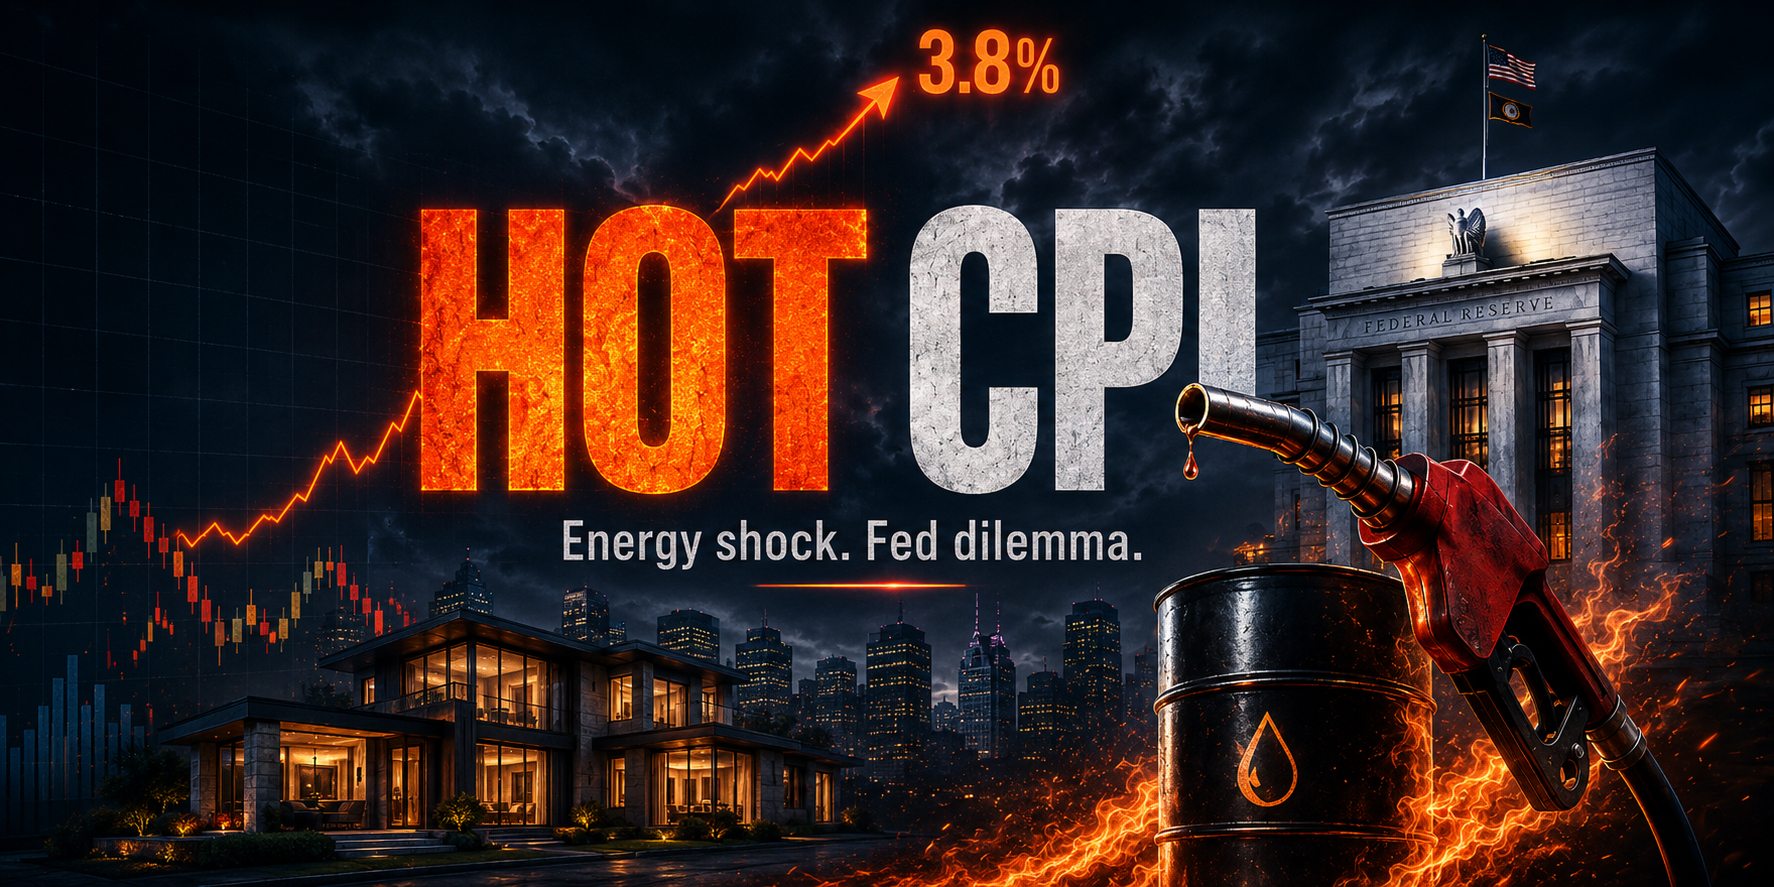
The April CPI Report Just Landed — and It Came in Hotter Than Expected. The Fed's Job Just Got Harder.
The April Consumer Price Index is out. Headline inflation came in at 3.8% year over year — above the 3.7% consensus forecast and the highest annual inflation rate since May 2023. The monthly reading was 0.6%, right in line with forecasts. Markets are digesting the report now.
The headline number is the Iran war's energy shock, made legible in a single statistic.
📊 The Numbers at a Glance
- Headline CPI (YoY): 3.8% — above the 3.7% consensus, highest since May 2023
- Headline CPI (MoM): +0.6% — in line with forecasts, easing from March's 0.9% surge
- Core CPI (YoY): 2.8% — above the 2.7% consensus, highest since September
- Core CPI (MoM): +0.4% — above the 0.3% forecast, up from 0.2% in both February and March
- Energy (YoY): +17.9% — up sharply from 12.5% in March
- Gasoline (YoY): +28.4% — up from 18.9% in March
- Fuel oil (YoY): +54.3%
- Shelter (YoY): +3.3% — up from 3.0% in March
- Food (YoY): +2.3%
The monthly easing from 0.9% in March to 0.6% in April is a genuine relief — March was the largest single-month CPI jump since June 2022. But the annual rate acceleration from 3.3% to 3.8% is the number that matters most for the Fed.
⛽ This Is an Energy Story — With a Worrying Twist
The headline number is almost entirely an energy story. Energy costs jumped 17.9% year over year in April, accounting for over 40% of the monthly all-items increase according to the BLS. Gasoline is up 28.4% year over year. Fuel oil is up 54.3%. These are direct, mechanical consequences of the Iran war's disruption to global oil supply — prices that consumers cannot avoid and that the Federal Reserve cannot fix by raising interest rates.
That part of the story is uncomfortable but not surprising. What is more concerning is the core number.
Core CPI — which strips out food and energy to get a cleaner read on underlying inflation — came in at 0.4% month over month, above the 0.3% forecast and well above the 0.2% readings in February and March. That does not prove inflation is spreading yet, but it raises the risk that the energy shock is starting to bleed into stickier categories.
One important caveat before drawing conclusions from that core number: April's report included one-time adjustments to rent and owners' equivalent rent indices to compensate for shortfalls caused by last fall's government shutdown. That means some of the core acceleration today may be a statistical catch-up rather than a true underlying trend — and May's core reading may be correspondingly softer. Worth holding that in mind before treating 0.4% as the new baseline.
That said, shelter inflation did tick up from 3.0% to 3.3% year over year. Shelter is the largest single component of the CPI basket and tends to be sticky — it doesn't reverse quickly even when underlying conditions improve. One month is not a trend. But it's a data point worth watching.
🏦 What This Does to the Fed
This is the report Kevin Warsh did not want for his first month as Fed chair.
Before this morning, futures traders were already not expecting any rate cuts in 2026. What today's report does is shift the conversation slightly in the other direction — toward whether the Fed needs to sound more hawkish at its June 17 meeting, even if it holds rates steady. A hike is still not the base case, but the report makes it harder for the Fed to sound relaxed.
The specific dynamic making that conversation uncomfortable is the combination of a 3.8% headline rate with a core rate accelerating to 2.8%. The Fed's 2% target looks more distant today than it did a week ago. And the energy shock driving the headline is not something monetary policy can address — the Fed cannot reopen the Strait of Hormuz. What it can do is raise rates to suppress demand broadly, accepting slower growth and higher unemployment as the price of preventing energy inflation from feeding into wage expectations and services pricing.
That is the stagflation tension in its clearest form: inflation too high to cut, growth too fragile to hike, and the root cause sitting in a geopolitical conflict beyond the central bank's reach. Watch CME FedWatch through the day — if any meaningful probability of a June hike starts appearing, that is the signal the market has decided today's report changes the calculus materially.
🔮 What to Watch From Here
The Iran ceasefire. Trump described it as on "life support" this morning, just as the CPI landed. The single most important variable for the May CPI report — which drops on June 11, a week before Warsh's first meeting — is whether oil prices fall materially between now and then. A credible peace deal could quickly take pressure off headline inflation. A ceasefire collapse could push the next few CPI prints meaningfully higher.
Core's trajectory. The acceleration from 0.2% to 0.4% in core MoM is the number to watch in May. If it stays elevated or moves higher, the "this is just an energy story" narrative becomes harder to sustain and the Fed faces genuine pressure to act. If it reverts toward 0.2%, the energy story remains more contained and Warsh can credibly hold without signaling weakness.
💼 What This Means for Investors
Equities: The S&P 500 futures had already slipped before the report on Iran war concerns. A hotter-than-expected CPI removes any residual hope of Fed support in the near term. The "higher for longer" trade is back in focus, which is typically negative for high-multiple growth stocks and modestly positive for financial sector names that benefit from sustained higher rates.
Bonds: The 10-year Treasury yield will likely move higher on this data as markets price out any remaining probability of a 2026 cut. Watch the 2-year yield in particular — if it moves above 5%, that is the market pricing in meaningful probability of a hike, not just a hold.
Energy stocks: The CPI print confirms what everyone already knew — energy is the inflation driver. That is a tailwind for integrated oil companies and energy infrastructure names, partially offset by the ceasefire-on-life-support uncertainty that could reverse oil prices sharply if a deal lands.
Gold: A stagflation read — high inflation, weakening growth, a Fed that can't easily respond — is historically positive for gold. Watch for a move above $3,500 today if the market settles on the stagflation interpretation.
Sources
- CNBC — "CPI inflation April 2026": https://www.cnbc.com/2026/05/12/cpi-inflation-april-2026-.html
- Trading Economics — "United States Inflation Rate (April 2026)": https://tradingeconomics.com/united-states/inflation-cpi
- Kiplinger — "Inflation Spikes in April CPI Report on Higher Energy Costs": https://www.kiplinger.com/investing/economy/cpi-report-april-2026-what-to-expect
- BLS — Consumer Price Index News Release, April 2026: https://www.bls.gov/news.release/cpi.htm
- CME Group — FedWatch Tool: https://www.cmegroup.com/markets/interest-rates/cme-fedwatch-tool.html
Market Munchies and Mode Mobile communications are for informational purposes only, and are not a recommendation, solicitation, or research report relating to any investment strategy, security, or digital asset. All investments involve risk including the loss of principal and past performance does not guarantee future results.
Any information contained in this commentary does not purport to be a complete description of the securities, markets, or developments referred to in this material. The information has been obtained from sources considered to be reliable, but we do not guarantee that the foregoing material is accurate or complete. There is no guarantee that any statements or opinions provided herein will prove to be correct.